Displaying Multi-Charts in Analysis
The Analysis multi-chart feature allows you to display multiple charts in a single Analysis report. For example, you can use this feature when you want to display the same data over different years. The multi-chart feature prevents you from having to create separate filters and reports.
1. Create or open an Analysis report.

 Important:
 You must have Auto-Refresh Mode disabled (see the section
Disabling Auto Refresh Mode above) to use the Multi-Chart feature.
2. Click the Switch to Chart Format button,  , to change to chart format.
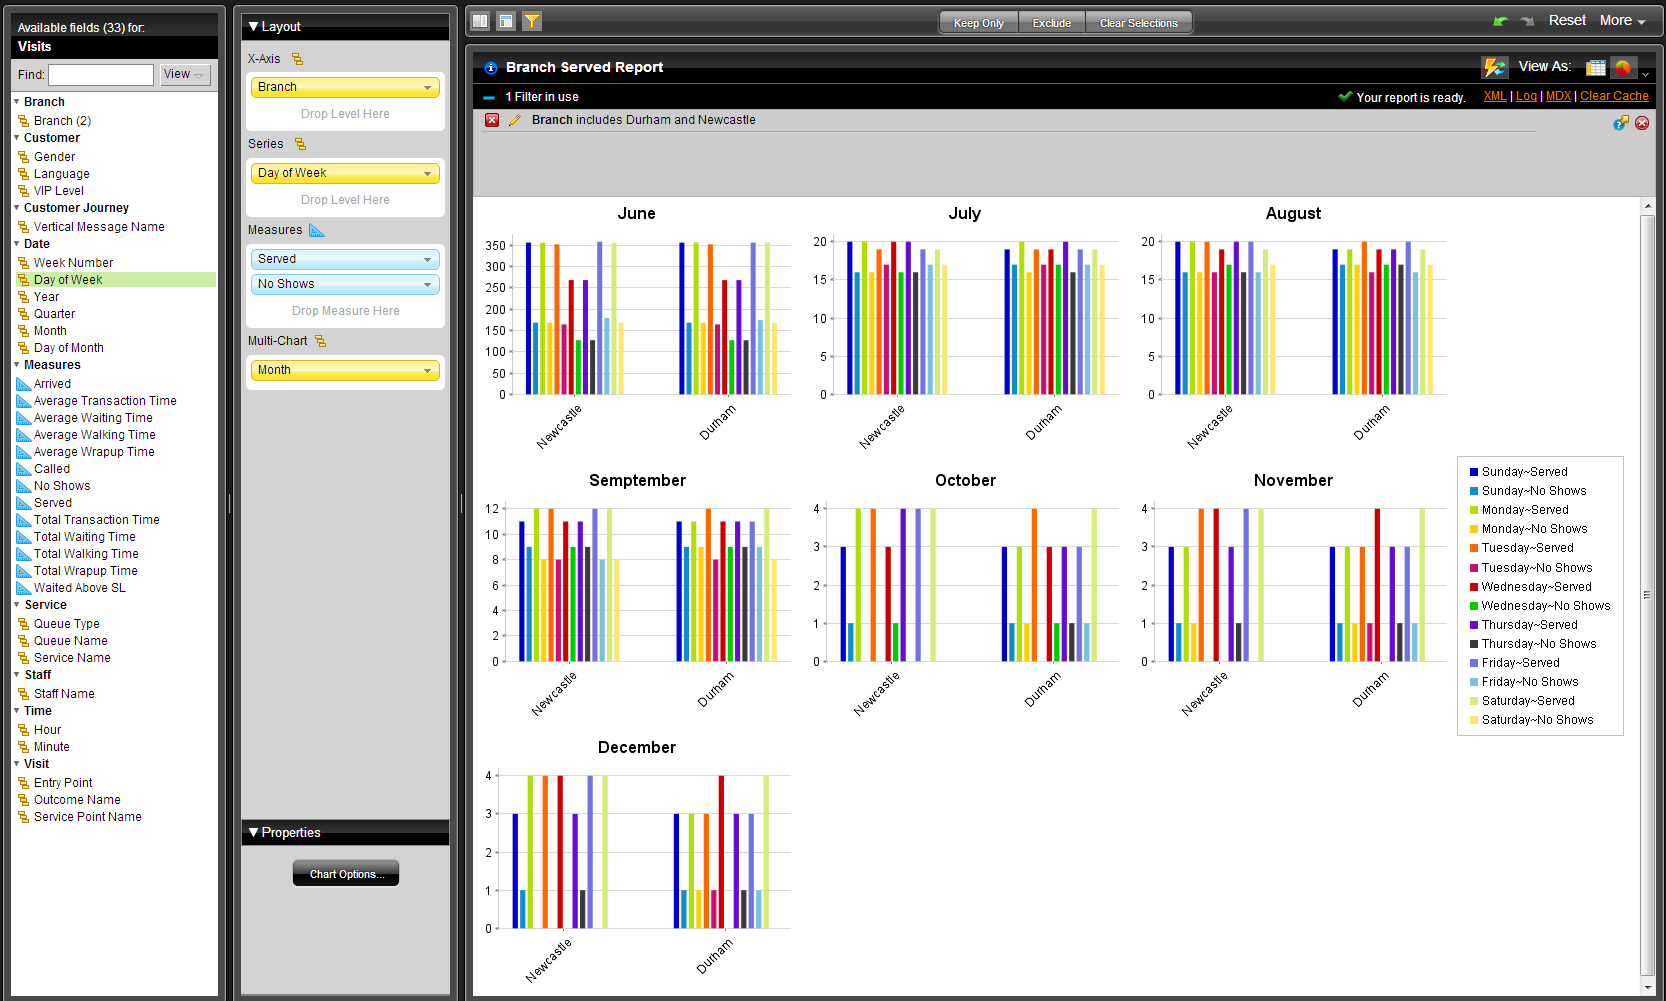
 3. Move the appropriate fields into the Multi-Chart section. The field auto populates with the different charts dependent upon the level placed in the Multi-Chart field.
4. Save the report.