Name | Definition |
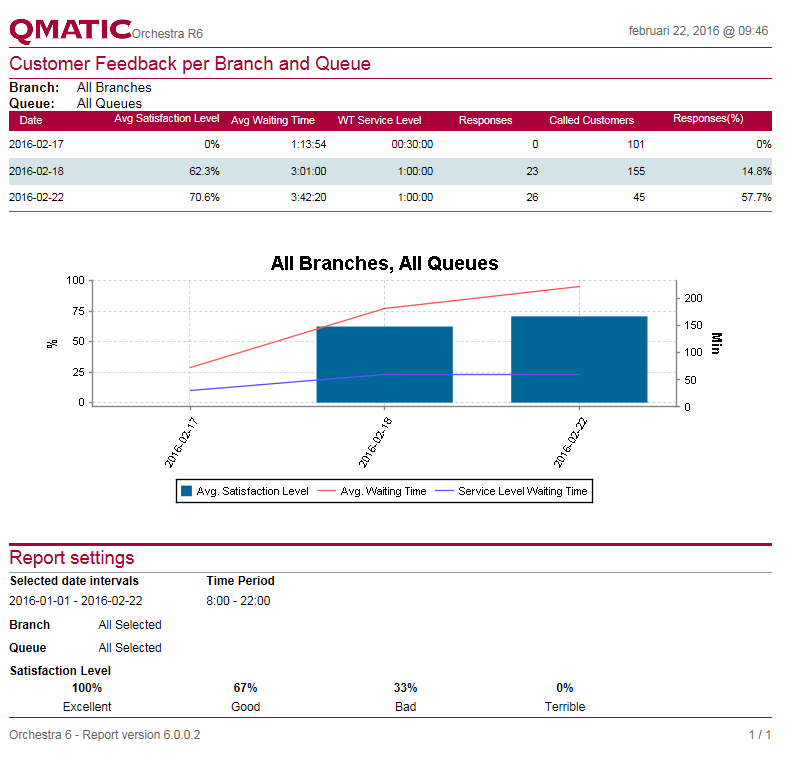
Date | Dates |
Avg. Satisfaction Level | The average of all included answers (100, 67, 33, and 0). |
Avg. Waiting Time | The average waiting time for all called Customers. |
Waiting Time Service Level | The service time level |
Responses | Number of Customers that provided a response. |
Called Customers | Number of called Customers |
Responses % | % of called customers that provide a response. |
Name | Definition |
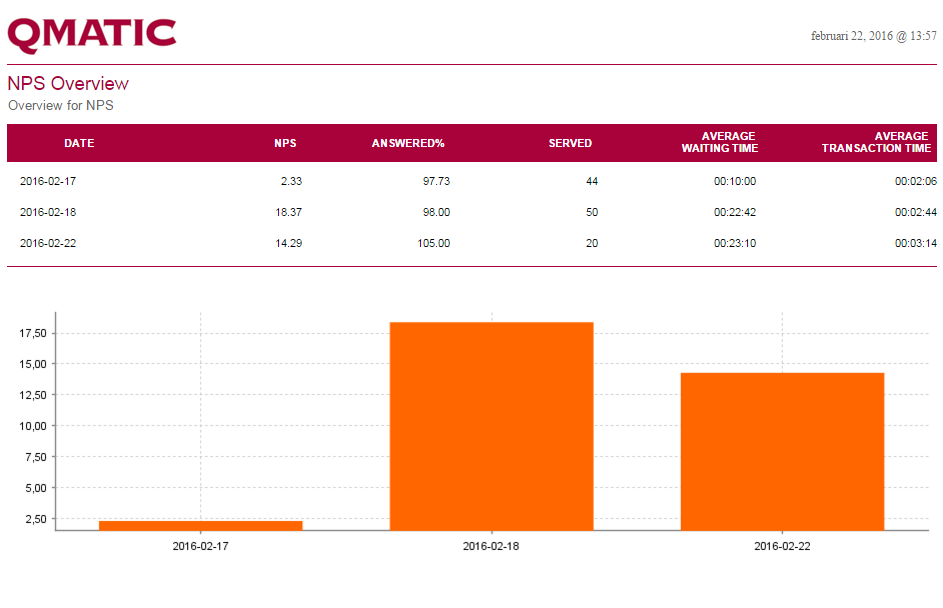
Date | Shows Day, Week, Month, Year or Weekday, depending on the View parameter. |
NPS | Net Promoter Score NPS = Promoters (%) - Detractors (%) Promoters = 9 and 10 Detractors = 0 through 6. |
Answered (%) | Percent of all served Customers that provided an answer. |
Served | Number of served Customers. |
Average waiting time | Average waiting time for all served Customers. |
Average transaction time | Average transaction time for all served Customers. |
Total, NPS | NPS for all included served Customers. |
Total, Answered | Percent of total number of served Customers that answered. |
Total, Served | The total number of served Customers. |
Total, Average waiting time | The average waiting time for all included Customers. |
Total, Average transaction time | The average transaction time for all included Customers. |
Graph, Y-axis | Fixed 0-100 % if there is no negative value or fixed -100-100% if there is a negative value. |
Name | Definition |
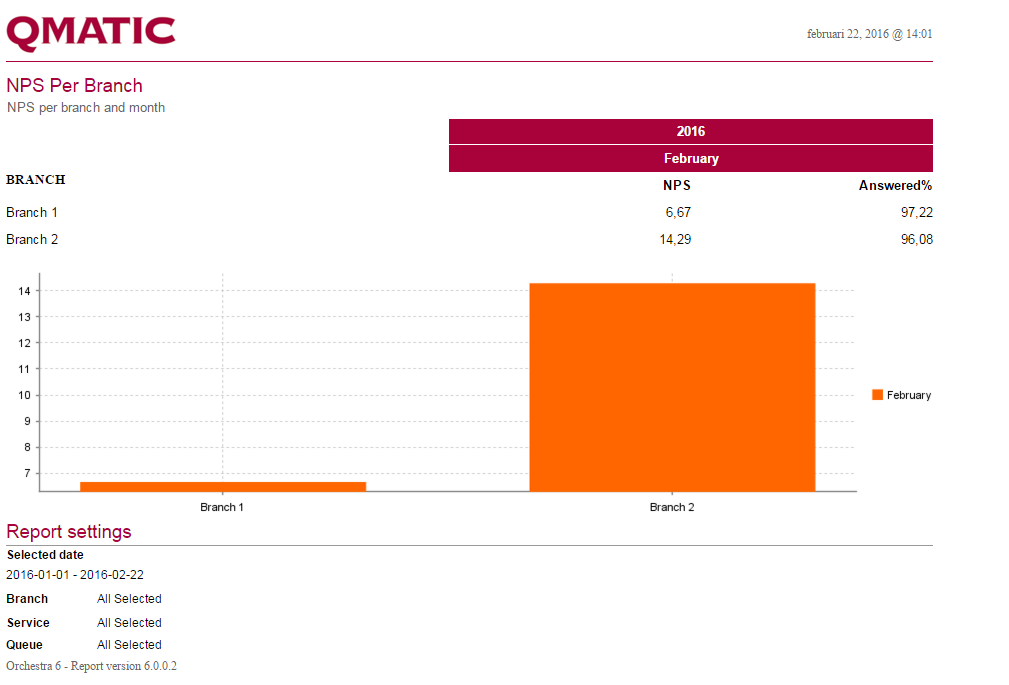
Branch | The selected Branches. |
NPS | Net Promoter Score per year and month. |
Answered (%) | Percent of all served Customers that provided an answer. |
Graph, Y-axis | Fixed 0-100 % if there is no negative value or fixed -100-100% if there is a negative value. |
Name | Definition |
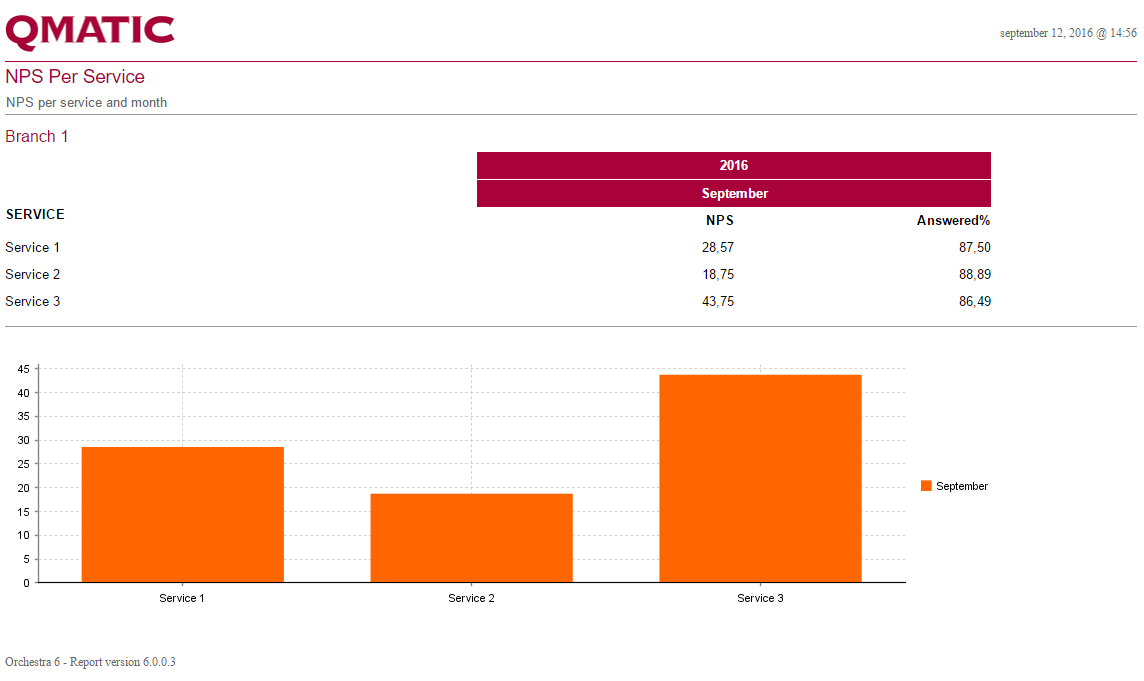
Service | The selected Services. |
NPS | Net Promoter Score per year and month. |
Answered (%) | Percent of all served Customers that provided an answer. |
Graph, Y-axis | Fixed 0-100 % if there is no negative value or fixed -100-100% if there is a negative value. |